Compendium of historic weather data
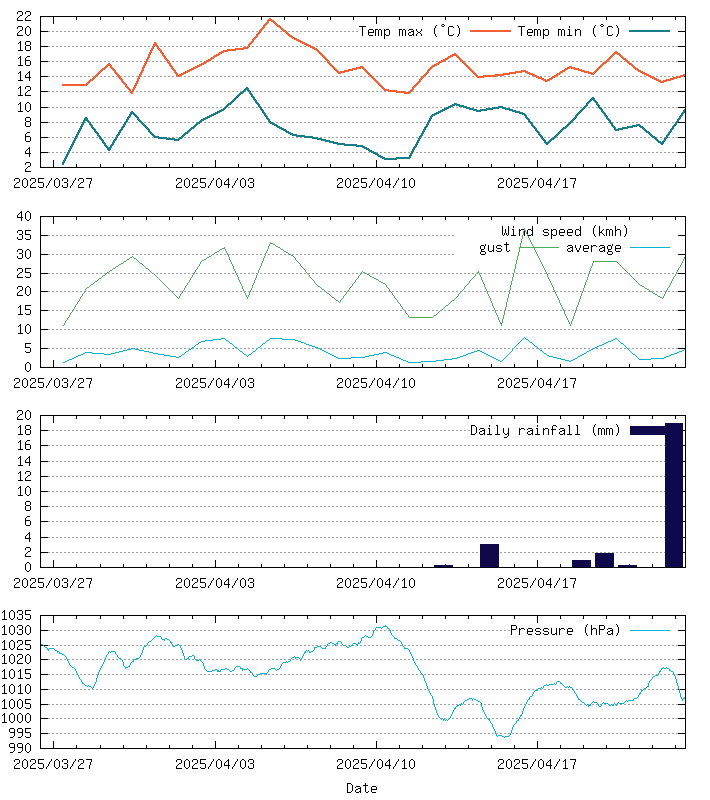
Summary of the last month
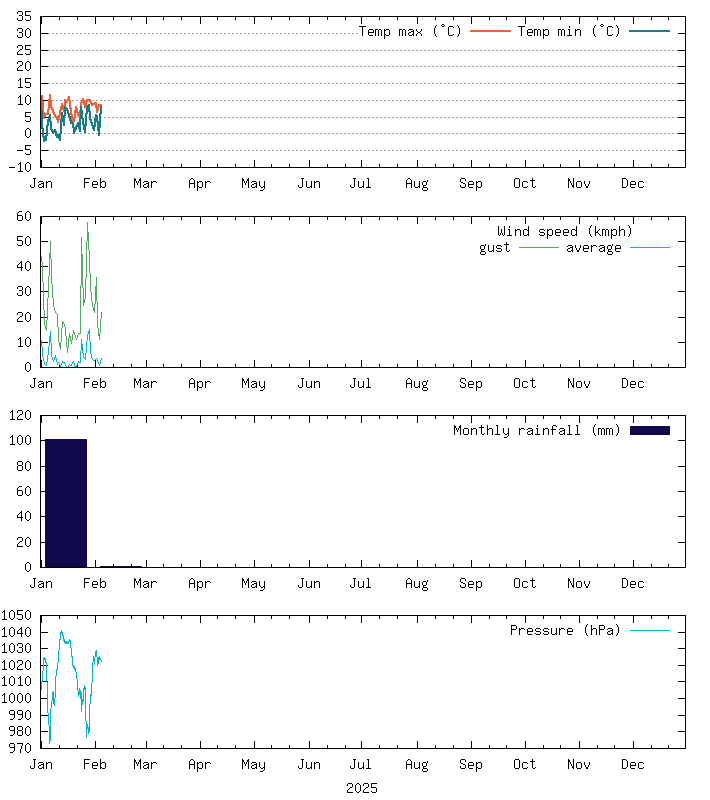
Summary of the year so far
Monthly summary so far
| Month | Temperature (°C) | Rainfall (mm) | |||||
|---|---|---|---|---|---|---|---|
| daytime maximum | nighttime minimum | ||||||
| high | avg | low | high | avg | low | ||
| Oct 2025 | 18.7 | 17.6 | 15.6 | 15.1 | 11.0 | 8.6 | 17.7 |
| Sep 2025 | 23.1 | 19.0 | 14.9 | 18.1 | 12.4 | 7.0 | 114.6 |
| Aug 2025 | 27.5 | 22.0 | 19.5 | 19.3 | 15.2 | 12.0 | 29.7 |
| Jul 2025 | 25.3 | 22.3 | 19.1 | 18.8 | 15.7 | 12.0 | 75.0 |
| Jun 2025 | 25.6 | 20.4 | 15.2 | 19.4 | 14.6 | 8.3 | 14.7 |
| May 2025 | 23.5 | 18.0 | 14.5 | 14.1 | 10.4 | 4.5 | 36.9 |
| Apr 2025 | 22.7 | 16.0 | 11.8 | 12.8 | 8.0 | 3.0 | 25.2 |
| Mar 2025 | 18.4 | 11.8 | 7.4 | 10.8 | 5.2 | -1.0 | 9.6 |
| Feb 2025 | 12.0 | 8.1 | 4.4 | 9.3 | 4.1 | -0.5 | 38.1 |
| Jan 2025 | 11.4 | 7.6 | 3.2 | 8.5 | 2.9 | -2.3 | 101.4 |
| Dec 2024 | 13.1 | 9.3 | 4.6 | 10.8 | 6.4 | 1.4 | 36.9 |
| Nov 2024 | 16.0 | 11.5 | 3.5 | 13.2 | 7.2 | -0.7 | 66.9 |
| Oct 2024 | 19.1 | 16.2 | 11.4 | 15.4 | 11.5 | 5.8 | 97.8 |
| Sep 2024 | 27.9 | 19.3 | 13.8 | 17.9 | 12.2 | 5.7 | 163.8 |
| Aug 2024 | 25.1 | 21.7 | 18.1 | 21.3 | 15.4 | 11.0 | 45.6 |
| Jul 2024 | 28.9 | 20.8 | 17.6 | 18.9 | 14.5 | 11.3 | 75.9 |
| Jun 2024 | 26.4 | 19.5 | 16.3 | 17.0 | 11.8 | 7.5 | 16.5 |
| May 2024 | 21.8 | 17.5 | 13.4 | 14.8 | 11.7 | 8.3 | 33.9 |
| Apr 2024 | 15.8 | 14.0 | 12.4 | 11.7 | 9.7 | 5.2 | 27.9 |
| Mar 2024 | 14.3 | 11.4 | 9.1 | 10.4 | 6.9 | 0.9 | 96.9 |
| Feb 2024 | 16.2 | 10.7 | 6.7 | 10.2 | 7.1 | -0.4 | 157.5 |
| Jan 2024 | 12.5 | 7.8 | 2.0 | 10.5 | 3.5 | -4.5 | 67.5 |
| Dec 2023 | 13.9 | 10.5 | 3.3 | 11.4 | 7.5 | -1.3 | 133.8 |
| Nov 2023 | 15.0 | 11.8 | 4.4 | 12.6 | 6.8 | -1.2 | 151.5 |
| Oct 2023 | 22.4 | 17.5 | 12.1 | 16.5 | 11.5 | 4.7 | 248.4 |
| Sep 2023 | 28.5 | 22.3 | 18.3 | 19.8 | 15.5 | 8.0 | 48.0 |
| Aug 2023 | 24.3 | 20.9 | 15.7 | 18.3 | 14.4 | 10.8 | 65.1 |
| Jul 2023 | 25.2 | 20.5 | 18.2 | 18.9 | 14.6 | 10.3 | 72.3 |
| Jun 2023 | 27.6 | 22.2 | 18.4 | 17.9 | 14.2 | 8.9 | 48.3 |
| May 2023 | 22.3 | 17.6 | 13.2 | 12.3 | 9.5 | 6.2 | 30.9 |
| Apr 2023 | 17.2 | 13.1 | 9.1 | 10.9 | 7.2 | 3.1 | 69.0 |
| Mar 2023 | 10.5 | 7.5 | 1.8 | 10.1 | 3.9 | 1.2 | 30.6 |
| Feb 2023 | 14.4 | 10.8 | 8.6 | 10.1 | 4.8 | -1.2 | 3.6 |
| Jan 2023 | 13.1 | 9.7 | 1.7 | 12.3 | 5.1 | -1.8 | 72.6 |
| Dec 2022 | 13.5 | 8.9 | 2.9 | 11.4 | 4.6 | -2.9 | 103.8 |
| Nov 2022 | 18.8 | 14.6 | 8.5 | 15.0 | 9.4 | 3.5 | 201.3 |
| Oct 2022 | 21.3 | 19.2 | 17.3 | 17.2 | 12.9 | 6.4 | 45.6 |
| Sep 2022 | 26.7 | 21.1 | 16.6 | 18.9 | 12.8 | 5.7 | 80.1 |
| Aug 2022 | 32.7 | 25.6 | 20.9 | 20.1 | 16.6 | 12.2 | 48.0 |
| Jul 2022 | 33.9 | 24.7 | 20.0 | 23.6 | 16.2 | 12.1 | 9.0 |
| Jun 2022 | 27.3 | 21.3 | 17.3 | 16.8 | 13.4 | 8.8 | 27.9 |
| May 2022 | 22.7 | 18.5 | 14.3 | 14.9 | 10.7 | 6.7 | 53.7 |
| Apr 2022 | 20.2 | 15.6 | 9.0 | 11.1 | 7.2 | -0.6 | 16.2 |
| Mar 2022 | 19.6 | 13.5 | 8.1 | 11.1 | 6.8 | 1.6 | 31.8 |
| Feb 2022 | 14.5 | 11.6 | 8.8 | 10.9 | 6.8 | 1.0 | 58.8 |
| Jan 2022 | 14.3 | 10.4 | 5.0 | 12.3 | 4.4 | -1.7 | 46.8 |
| Dec 2021 | 14.1 | 10.7 | 6.4 | 12.8 | 7.4 | 1.1 | 43.2 |
| Nov 2021 | 16.0 | 12.3 | 5.3 | 12.8 | 6.8 | -0.9 | 4.5 |
| Oct 2021 | 20.6 | 17.3 | 14.1 | 16.5 | 11.4 | 4.4 | 118.8 |
| Sep 2021 | 27.3 | 21.9 | 17.2 | 19.3 | 14.1 | 6.1 | 56.4 |
| Aug 2021 | 25.0 | 21.4 | 18.4 | 17.0 | 14.4 | 12.1 | 28.2 |
| Jul 2021 | 28.6 | 22.7 | 18.7 | 18.3 | 15.5 | 11.8 | 33.3 |
| Jun 2021 | 24.9 | 20.6 | 14.2 | 17.6 | 13.5 | 9.1 | 78.6 |
| May 2021 | 23.7 | 16.3 | 13.1 | 13.6 | 8.7 | 2.1 | 65.7 |
| Apr 2021 | 18.0 | 12.9 | 8.0 | 7.5 | 3.4 | -1.1 | 2.4 |
| Mar 2021 | 18.7 | 11.9 | 7.0 | 10.7 | 5.0 | -2.7 | 17.1 |
| Feb 2021 | 13.7 | 8.4 | -0.4 | 9.7 | 4.5 | -2.4 | 44.4 |
| Jan 2021 | 13.0 | 7.8 | 3.6 | 9.2 | 2.9 | -3.7 | 96.6 |
Notes:
1. The meteorological day we use follows Met
Office standard practice, ie. beginning at 0900 GMT (1000 BST).
2. Data in between 10 March 2023 and 8 April 2023 are missing due to a
failure in hardware.
3. Prior to 10 March 2023 this station was using a WH1081 type weather
station. After 8 April 2023 a W-8681-MkII weather station has been used.
Summary graphs for previous years
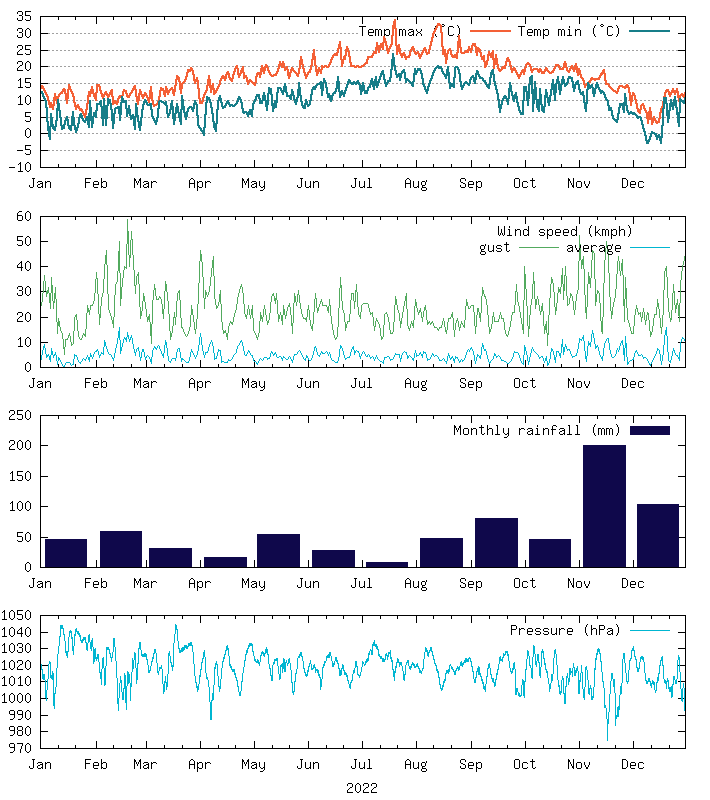
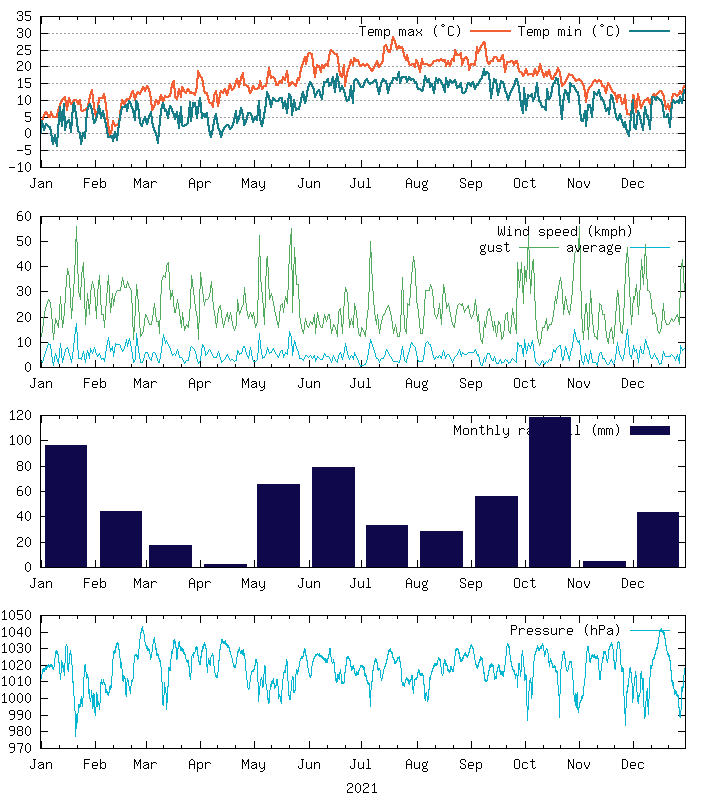
Blog posts
- January went for a swim, February has stayed on the side ... so far
- Low pressure, not no pressure
- Weather station hardware problems - resolved!
- Seems like 5G on Vodafone has arrived in Worthing (Updated- Not so much)
- Dry, but not completely
- Drier, colder, more photogenic...
- So far October is the wettest month of the year
- September beats August's average temperatures
- Which month will be the greatest?
- Tinkering with colouring and contemplating theming
- It's tough to turn tables into a tantalizing topic
- Ale never go to the steak for my Pi
- It's there and it's happening, even though you can't see it yet. But you will. Honest.
- That's one small weather database for mankind, one ... erm ... no, it's really just a small database.
Subscribe via RSS